So you’re thinking about measuring the coverage of your developers’ unit tests using a code coverage tool. Many code coverage tools are commercially available for .NET development, but you may be looking for a free and open-source code coverage tool.
You are not alone. Trust me; a lot of developers are looking for an effective, free code coverage tool. The good news is that there is one. This is why I decided to write today’s post.
Before I delve into the details, let me provide some background on code coverage analysis.
Code Coverage
Code coverage tools measure how completely a program runs as it is running. The trick is to run the software while the code coverage tool is monitoring the program. In common practice, automated unit tests are what exercise the program so that the code coverage tool can perform its measurements.
The subject of automated unit testing is a bigger topic than I can do justice in this blog. However, let it be enough to say that the unit tests are written to check that the code works as the developer intended it to work. And so, the question is: what code is not being tested by the unit tests? This question is answered by code coverage.
The amount of code that is tested by the unit tests is often reported as a coverage number, which indicates the percentage of code that is tested when the tests are run. The principle is that as a test coverage tool runs the unit tests, it monitors the code-under-test. The coverage tool tracks each symbol within the code-under-test and tracks these symbols as they are executed while the code is running. Note that a symbol can be thought of as any point in the code that is a valid breakpoint for the debugger. The percentage of symbols covered is analyzed and calculated. Various code coverage measures might include the following:
- Class – If the program-running-under-analysis (program) executes code within a class, then the coverage tool counts that class as visited. The coverage tool totals each visited class and computes a percentage of all the classes in the code that were visited during the run.
- Method – Every time the program executes a method, the coverage tool counts that visit. The coverage tool computes a percentage of the methods that were visited during the run.
- File – This is the percentage of source files with code that contains code executed during the run.
- Statement – If the program executes a statement, then the visit is counted. A percentage is calculated representing the percentage of statements visited during the run.
- Symbol – Every time the program executes a symbol in the code, the coverage tool counts that visit toward the percentage of the total symbols executed. This sometimes is referred to as Points coverage.
- Branch – A branch is any logic-branch in the code; for example, one if statement represents the branching logic for a code block. Every time the test code executes code within a branch, it counts that visit toward the percentage of total branches executed.
Code coverage can be an important part of the coding, design, testing, and maintenance aspects of software development. These tools provide the individual developer valuable feedback when writing automated unit tests. With code coverage, the developer finds the uncovered branches, exception scenarios, and corner-cases. The team leader can use these tools to gauge progress against code coverage objectives. When correctness is very important for a critical module, the team leader can monitor and insist that code coverage reach as close to 100% as is practicable. Similarly, improving code coverage is a measurable goal that the team can target.
OpenCover
OpenCover is a free and open source code coverage tool for .NET. It is a command-line utility that performs statement and branch coverage analysis. It generates XML output, but you can use a report generator tool to create reports from the output.
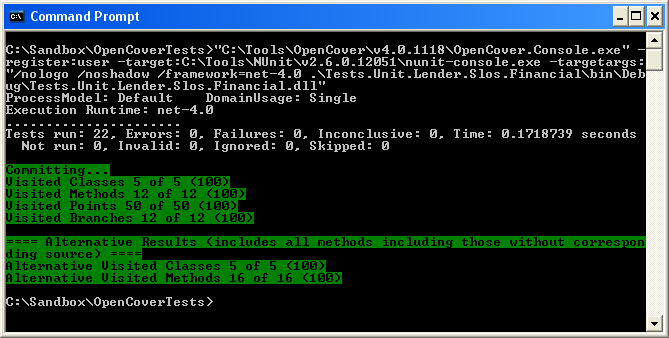
In the following screenshot, OpenCover is running a suite of NUnit tests. The number of tests that were run is 22. The highlighted output from OpenCover reports the number of visited classes is 5 of 5 (100%), methods is 12 of 12 (100%), etc.

Conclusion
OpenCover is a code coverage tool worth evaluating for all .NET Frameworks 2 and above (including Silverlight). OpenCover is capable of handling 32 and 64 bit processes. You can learn more about OpenCover on NuGet.
Do you prefer any other code coverage tools? We’d love to hear about them and any OpenCover experiences in the comments below!
Source: Stephen Ritchie, Pro .NET Best Practices (New York: Apress, 2011). Excerpted in part with permission of the author.