When working on data and analytics projects, we’re often asked to manage or present a single aspect of data. You may be working to solve a specific data problem, such as determining how to get data from one system to integrate with data from another system. Or you may be tasked with taking a big, messy database and visualizing it in a way that provides decision-makers with the information they need. But working with data is not so simple. To be successful, you must understand the entire life cycle of your data.
Defining The Holistic Data Life Cycle
The holistic data approach is a way for businesses to improve data analysis and integration. This works by enabling information to be distributed across the company more efficiently and consistently. The way we see it, the data life cycle exists in five phases. First, you gather your data, then you transform it into something useful, then you present and interpret your data, and finally maintain your data so that you can use it again. Simply (and visually) put, the data lifecycle looks something like this: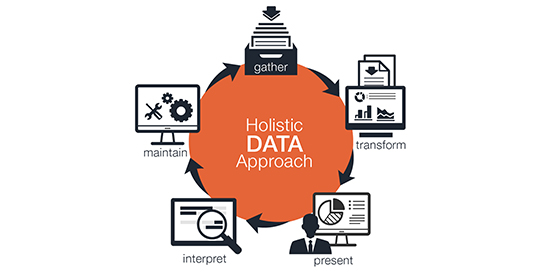
So, what do all these things really mean?
Phase 1: Data Collection
This can include the collection of data across structured, semi-structured, and unstructured sources including operational systems (like billing or CRM systems), website data, and social media data. Whether working with Big Data or traditional structured data sources, it’s important to identify where your data resides and how best to capture it.
Phase 2: Data Integration & Transformation
Quality integration of your data assets is the foundation that enables easy and swift access to information for your end users. Even with the advanced capabilities of data tools to bring data together on demand – a data integration strategy is required to ensure data quality and consistency. The best solutions provide processes that are repeatable, automated and able to be extended to meet future business needs.
Phase 3: Data Presentation
Your data is ready for its debut! Through different methods of presentation, you can uncover key metrics that will inform you on the current state, trends, and exceptions. Findings should be presented in the most effective format and are often built using popular Business Intelligence tools and formats, including operational reports, historical trend reporting, exception reports, executive dashboards, scorecards, and tailored web visualizations.
Phase 4: Data Interpretation
Intuitive data results are critical – initial interpretation of what your data is telling you should be easy and obvious. Of course, there are times you will want to dig deeper and explore data using statistical methods. Enter the realm of Data Science. Data Science is the practice of deriving insights from data and can encompass statistical analysis, predictive analytics, machine learning, text analytics, and more.
Phase 5: Data Maintenance
Maintaining the quality and consistency of data factors ensures that your data remains usable long term. Some tactics include data integration breakpoints, data quality thresholds and alerts, and audit reports that can be built into data integration designs and promote data consistency and data standards. Data Governance can include a selection and deployment of data quality tool suites, building master data repositories and creating and implementing data privacy strategies
Why is Understanding the Holistic Data Life Cycle Important?
Many of us see only one phase of the data lifecycle – often when it’s presented to us in a report or dashboard. Think of this as the dining room of the data life cycle. Before arriving on the table, the same data were raw ingredients in the kitchen that were blended together to make a meal.
If you skip the kitchen step and take the raw food and place it on the table, it will still give you nourishment. It could also be harder to chew, less tasty, and be an overall less satisfying experience. The same applies to skipping data integration steps – you’ll get data, but it may be more difficult to digest.
Consider data standards and data quality. While governance is shown at the end of the life cycle for the purposes of our diagram – in reality, we advocate that these practices are embedded throughout the design, build, and deployment of every delivery. The same way a good kitchen maintains standards of hygiene and uses quality ingredients.
In our data-driven age, with volumes growing so rapidly we are reaching the end of the alphabet to name the sizes (hello Zettabyte!), attention to the ongoing health and well-being of our data becomes critical. This requires a holistic view of the data life cycle, using proven practices throughout while avoiding common pitfalls to achieve the ever-present goal of truthful data.
Do you want to see more data resources? Take a look at our Data Lakes Advanced Analytics Ecosystem!