Colorado River Basin Data Visualization Challenge
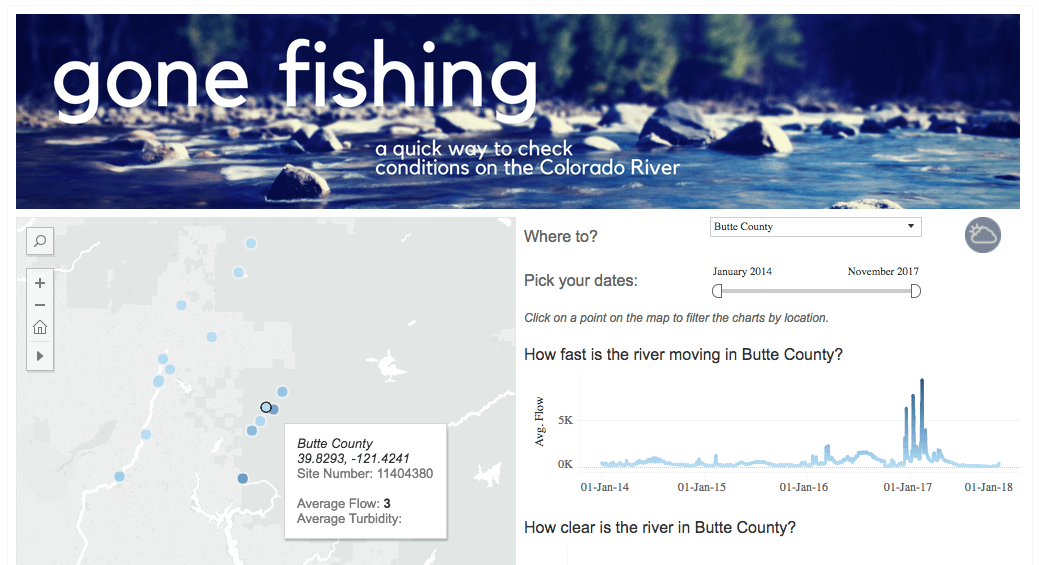
Over the last few weeks, Excella consultants with expertise in UI/UX, data visualization, and data science collaborated on a volunteer project to develop a prototype of an interactive tool to check fishing conditions on the Colorado River, as part of the Bureau of Reclamation’s Colorado River Visualization challenge.
Throughout the development process, the team followed a user-centered design process, focusing on one specific potential user of the available data: the recreational fisherman.
The team conducted user research with active recreational fishermen to understand the conditions they care about most. Based on these insights, the team sourced data from multiple open data sets on water temperature, flow rate, and turbidity at points along the river, developed a Python script for scraping and shaping the data, set up a Google Sheet for data storage that connects to Tableau, and designed a Tableau Public interactive display. The tools for data integration, analysis, and visualization were selected to be simple to transfer to a new product owner if required. The final prototype can be viewed on the Tableau Public Gallery.
Thank you to the core team of Excellians who contributed to this effort including Katy Kinsey, Hareem Mannan, Robin Tully, Mary Qaiwyy, and Kellen Rosenfelder. Dawn Barton and Amanda Makulec advised on UI/UX Design and Data Visualization respectively.