In my previous blog, I explained why learning about system models (also known as causal loop diagrams) was one of the most useful takeaways from Certified LeSS Practitioner training. These diagrams can be a powerful tool for creating a shared understanding of the system dynamics at work in an organization.
There are a few basic notations to learn if you want to create a causal loop diagram. I’ll introduce these notations through an example Craig Larman, co-founder of LeSS, used in training that I found particularly enlightening.
An Example
Consider how these variables interact with each other.
- # of product backlogs
- % of total (product) items a team knows well (requirements & design)
- Agility of teams to change direction at the company level
- % of items worked on each Sprint that are the highest value from a company view
- Likelihood that a single team will see they may be working on low-value items, from a company view
- Quality of progress overview of product (done, WIP, upcoming)
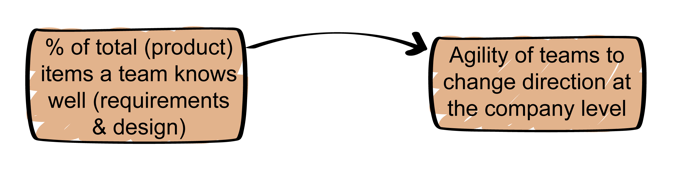
During training, my group eventually agreed that as the % of total (product) items a team knows well (requirements & design) increases, the agility of teams to change direction at the company level also increases. We figured that a team that knows more of the product requirements would more easily be able to switch priorities and change direction if needed.
In system modeling, you capture this causal link with the notation below. This shows a direct cause and effect between two variables, indicating that when one of the variables increases, the other variable also increases, and vice versa.
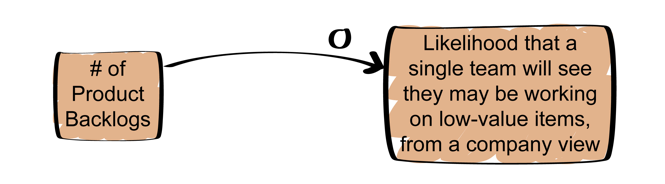
On the other hand, we came to realize that as the # of product backlogs increases, the likelihood that a single team will see they may be working on low-value items, from a company view decreases. If each team has its own backlog, it’s very possible that a team could end up delivering the top items on its backlog, not realizing that those items have lower organizational-level priority. The disparate backlogs don’t allow the team to easily identify this fact.
Opposite effects are captured with the below notation.
As we kept discussing and modeling the variable interactions, we ended up with the causal loop diagram below.
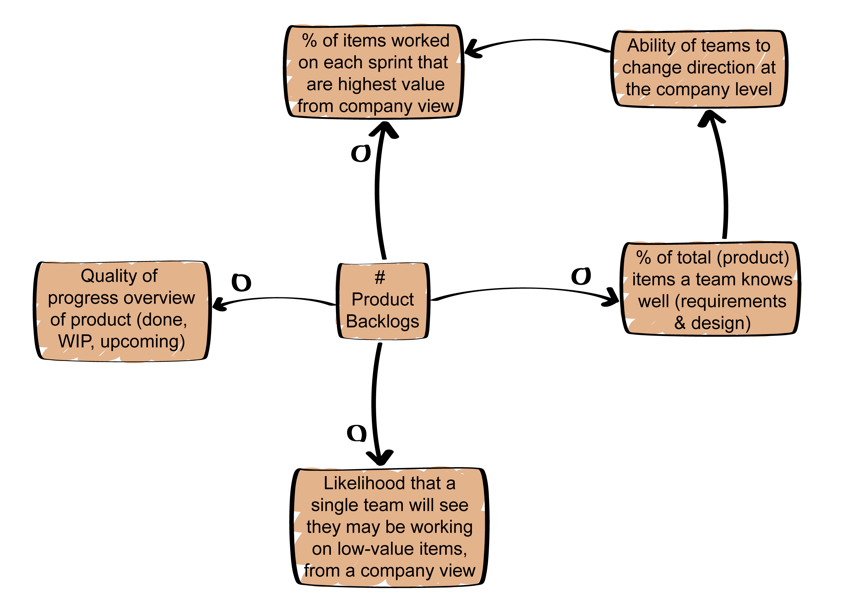
Creating the model above helped us realize that if our system optimizing goal was to increase Agility, by which we meant the ability of teams to change direction quickly and cheaply, we would want to keep the number of product backlogs as low as possible. In this way, we discovered, for ourselves, the logic behind the LeSS rule of 1 product backlog.
Without modeling the impact of the number of backlogs, it would have been easy to assume that having one backlog per team is most efficient. However, that’s an example of local optimization cognitive bias. It wasn’t until we captured the impacts on the whole system that we saw how having multiple backlogs hinders an organization’s overall agility.
A Couple More Notations
The example above includes just a handful of variables. However, it was only a small section of a much larger system model we created during training. The larger model pulled together many additional variables and their influences within the system. We used sticky notes for all the variables and drew the interactions on a whiteboard to allow for maximum flexibility as we brainstormed and collaborated.

This larger model included a couple of additional notations. Particularly extreme effects were noted by drawing a thicker line between two variables.

For cases where the impact may not appear for some time, you can indicate a delay by adding a gap in the influence line.

Also, be aware that, while not visualized differently, some links within the model are probabilistic (very likely to be the case) while others are definitional (always the case). An example of a definitional relationship is that as the # of features delivered per Sprint goes up, “velocity” will also go up.
Summary
As you probably realize by now, the notations used to create a system model are quite simple. The more challenging, but ultimately worthwhile, part is having the conversations needed to figure out how all the variables interact and how they influence each other.
For more information on causal loop diagrams and systems thinking in general, visit less.works, read the Systems Thinking chapter of Scaling Lean & Agile Development, written by the co-founders of LeSS, Craig Larman and Bas Vodde.