Microsoft and Tableau are two of three BI software vendors who are listed as leaders in Gartner’s 2016 Magic Quadrant for Business Intelligence and Analytics Platforms. Since Power BI is relatively new (initially released in 2014) in the industry, we wanted to take a look at how Microsoft Power BI compares to Tableau and share our findings since Power BI may be a more cost-effective option for organizations who are already using Office 365 and may not have the budget to purchase Tableau user licenses.
Comparing Power BI to Tableau
We’ve evaluated BI Tools in the past. For this comparison, we used a similar evaluation matrix that lists the criteria that organizations should take into consideration to accurately determine how Power BI performs comparing to Tableau.
Evaluation Findings
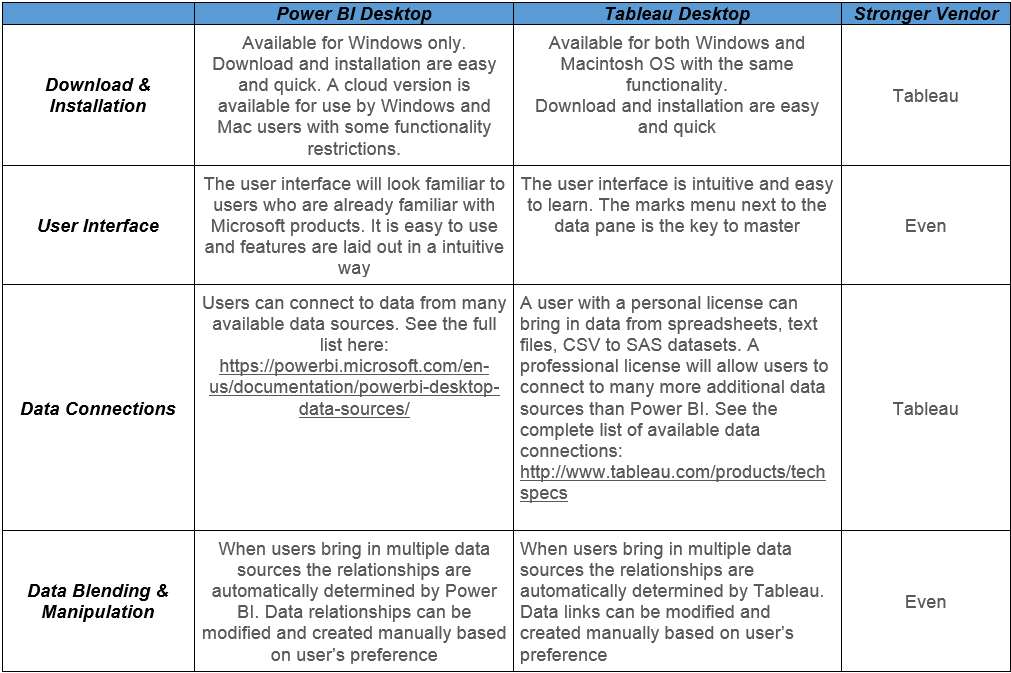
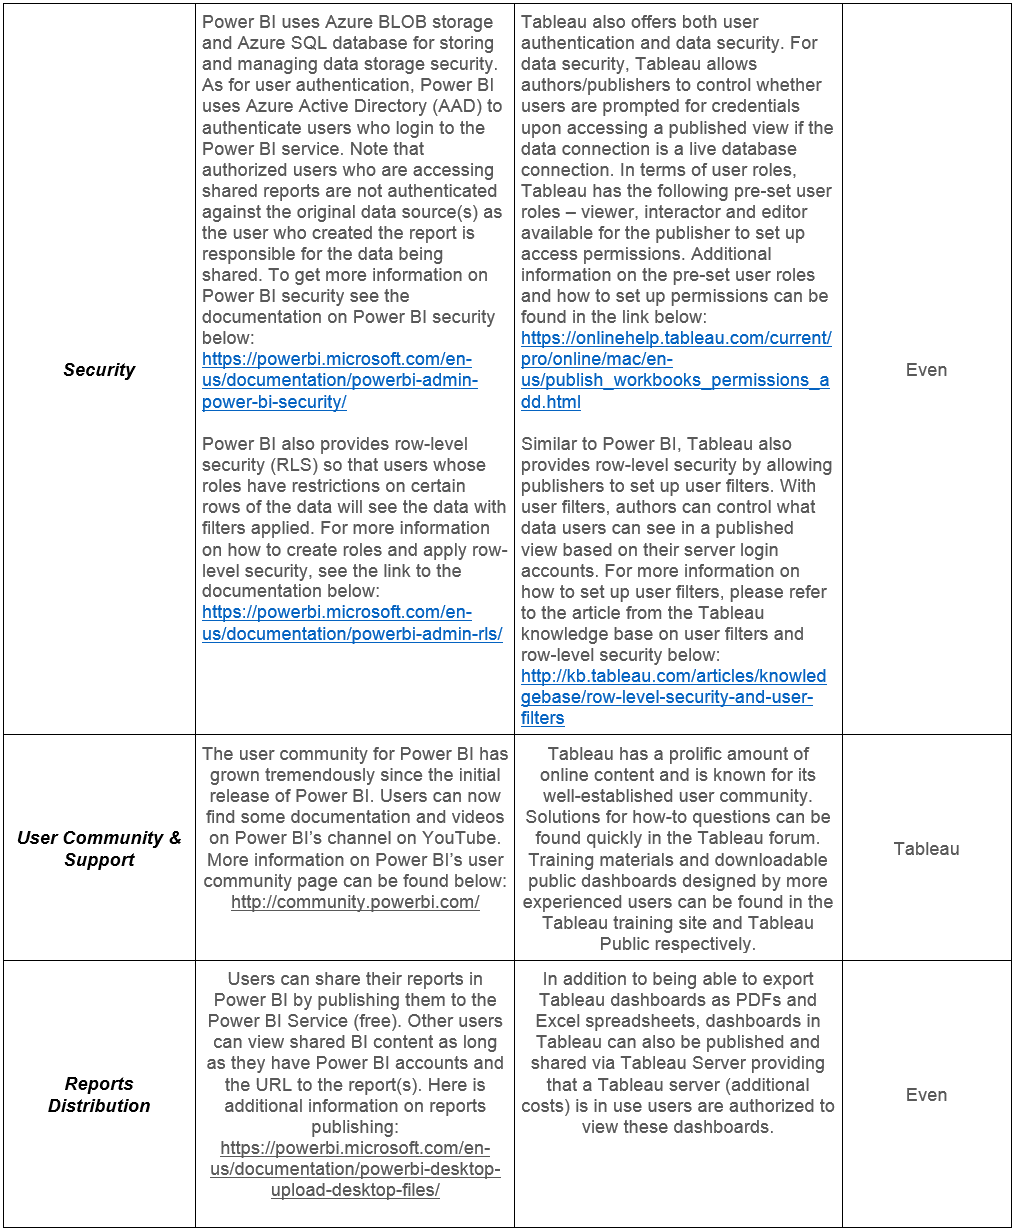
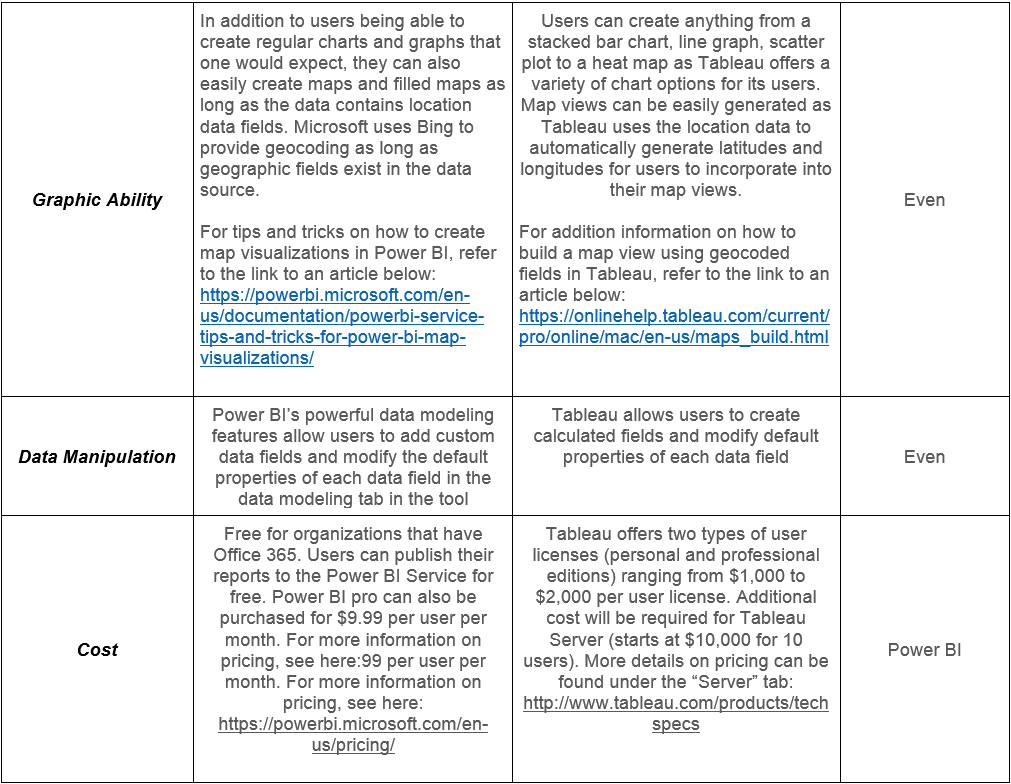
Overall Scores
Based on our evaluation of both tools above, Tableau received equal or higher ratings in 9 out of the 10 categories while Power BI received equal or higher ratings in 7 out of the 10 categories, which leads us to determine that Tableau is the better vendor in this comparison.
Conclusion
In summary, while Tableau offers the better BI solution in this comparison, Microsoft has made impressive advances in Power BI to narrow the gap. Microsoft releases new updates to Power BI on a frequent basis to improve system functionality and enhance user experience. Although Tableau provides more training materials and has a larger community of users, Microsoft has made progress in building its user community and providing documentation that users can leverage. Tableau is the more complete and popular BI tool on the market, while Power BI presents itself as a good alternative solution thanks to its competitive pricing and comparable features. The integration of Power BI as one of the available Office 365 apps, enables it as a cloud-based analytics solution that is easy for users to create, view and share reports across organizations.
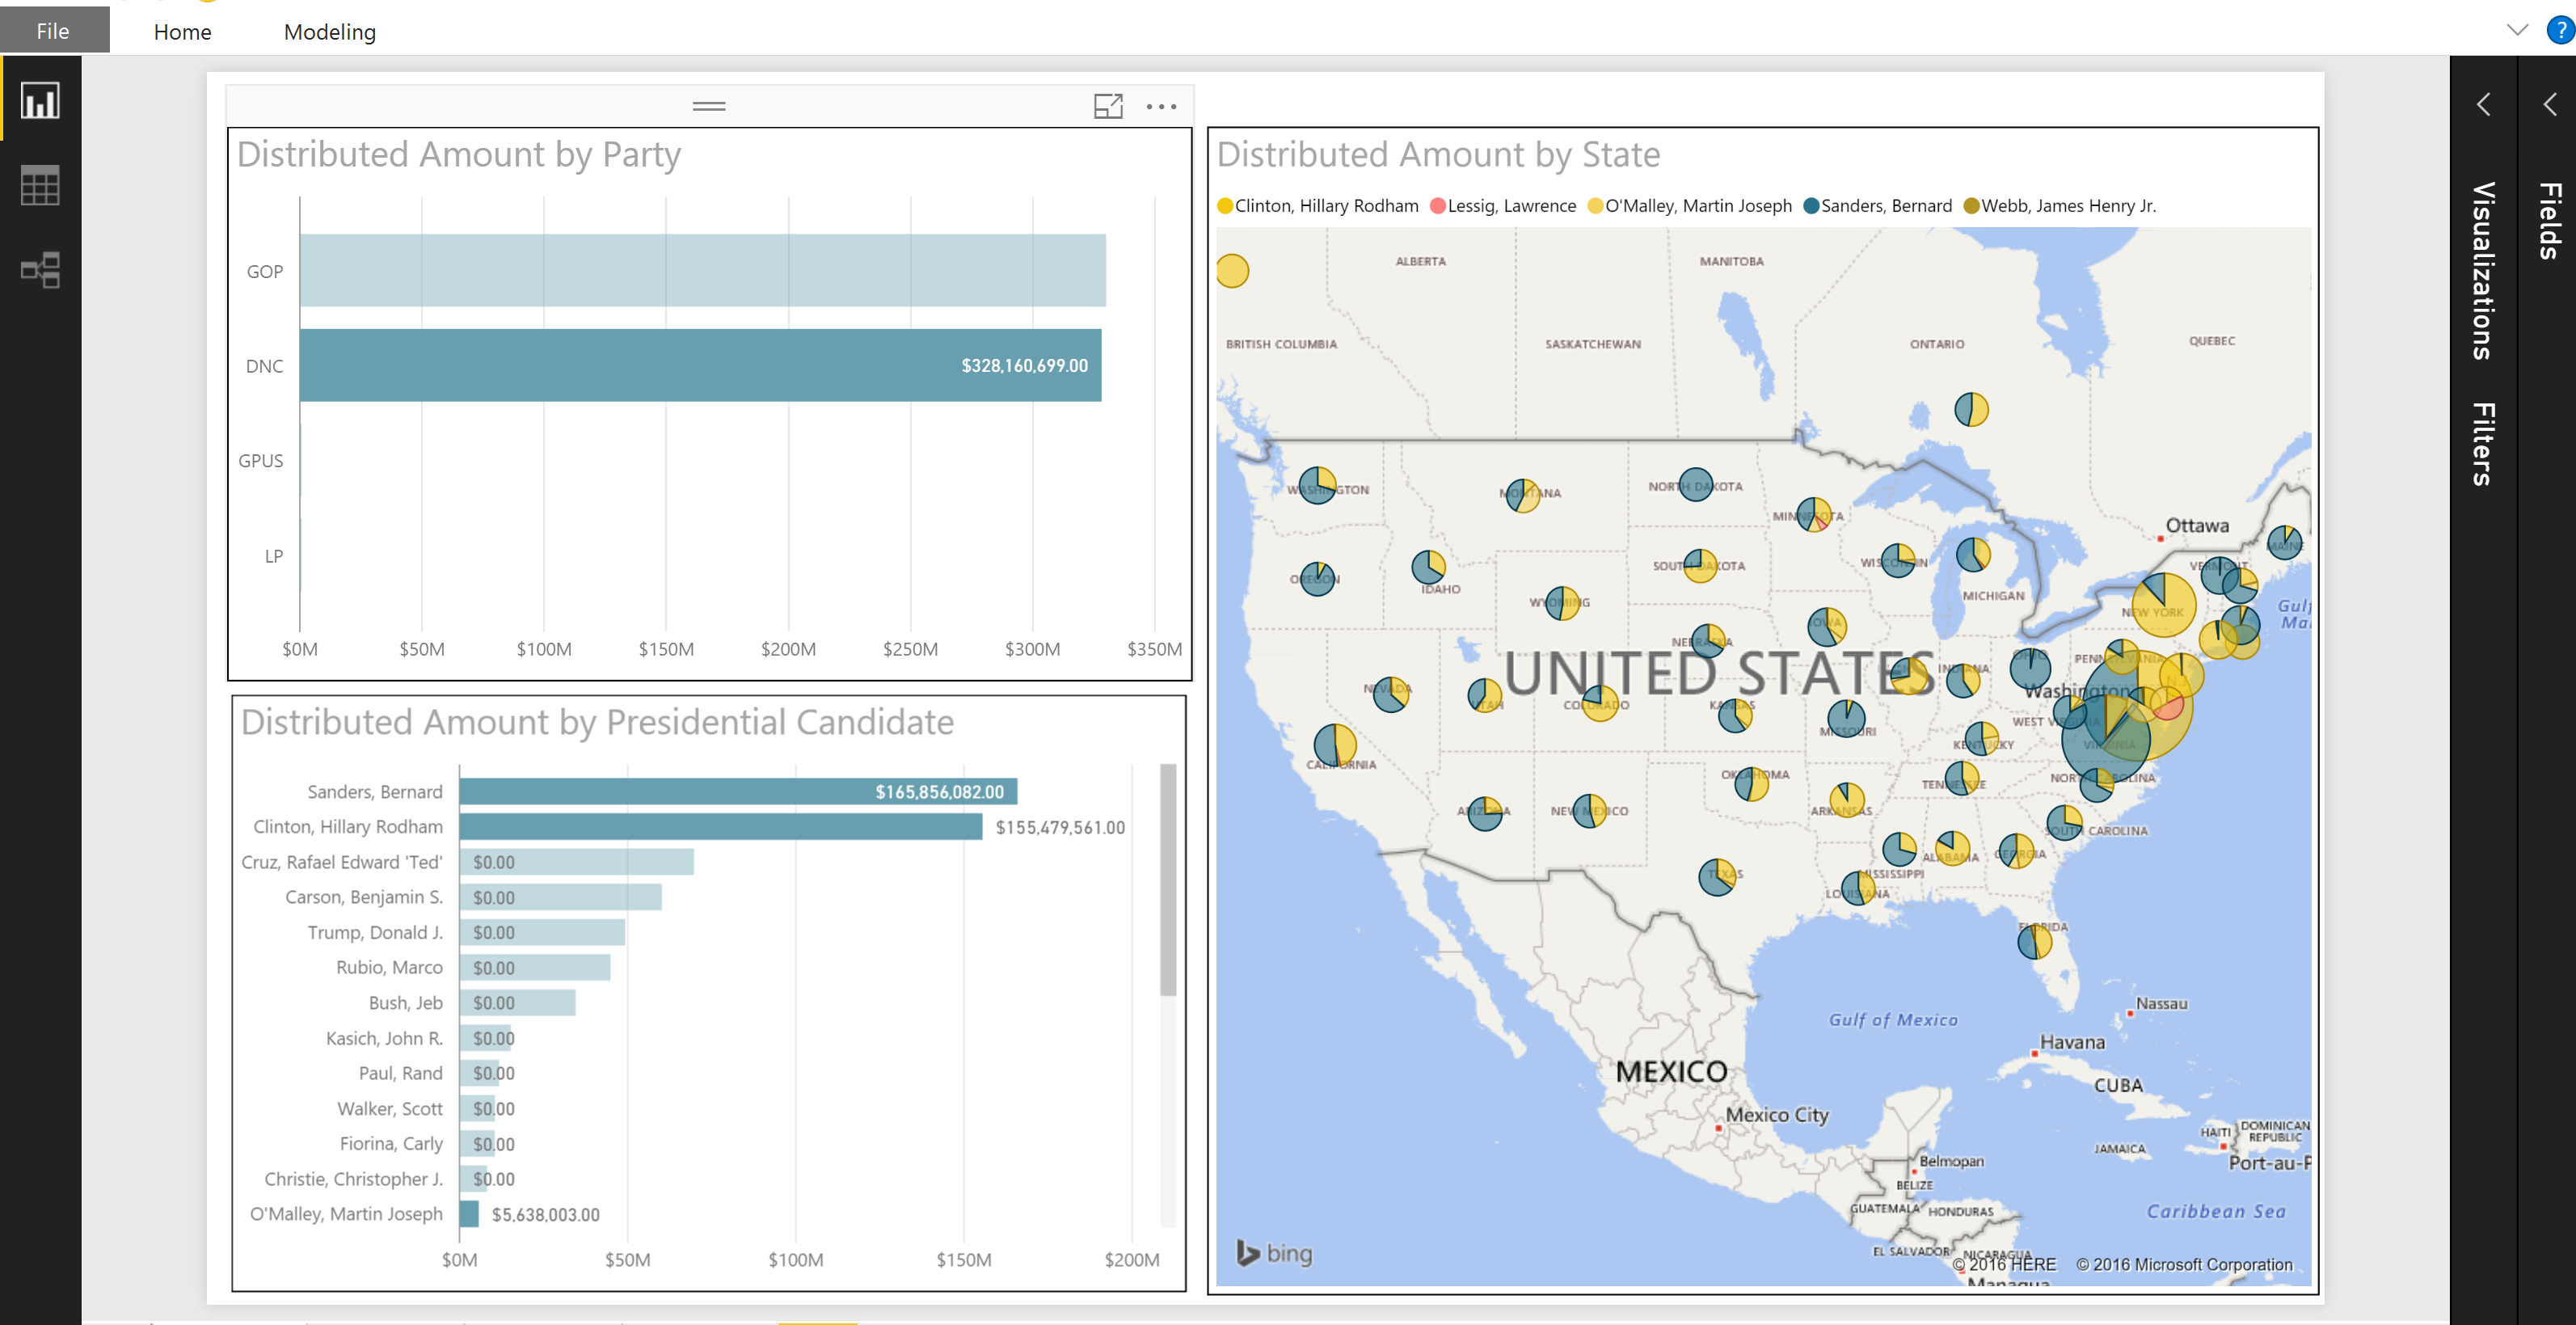
Screenshot 1: Sample Dashboard Created in Power BI Desktop using public presidential candidate spending data
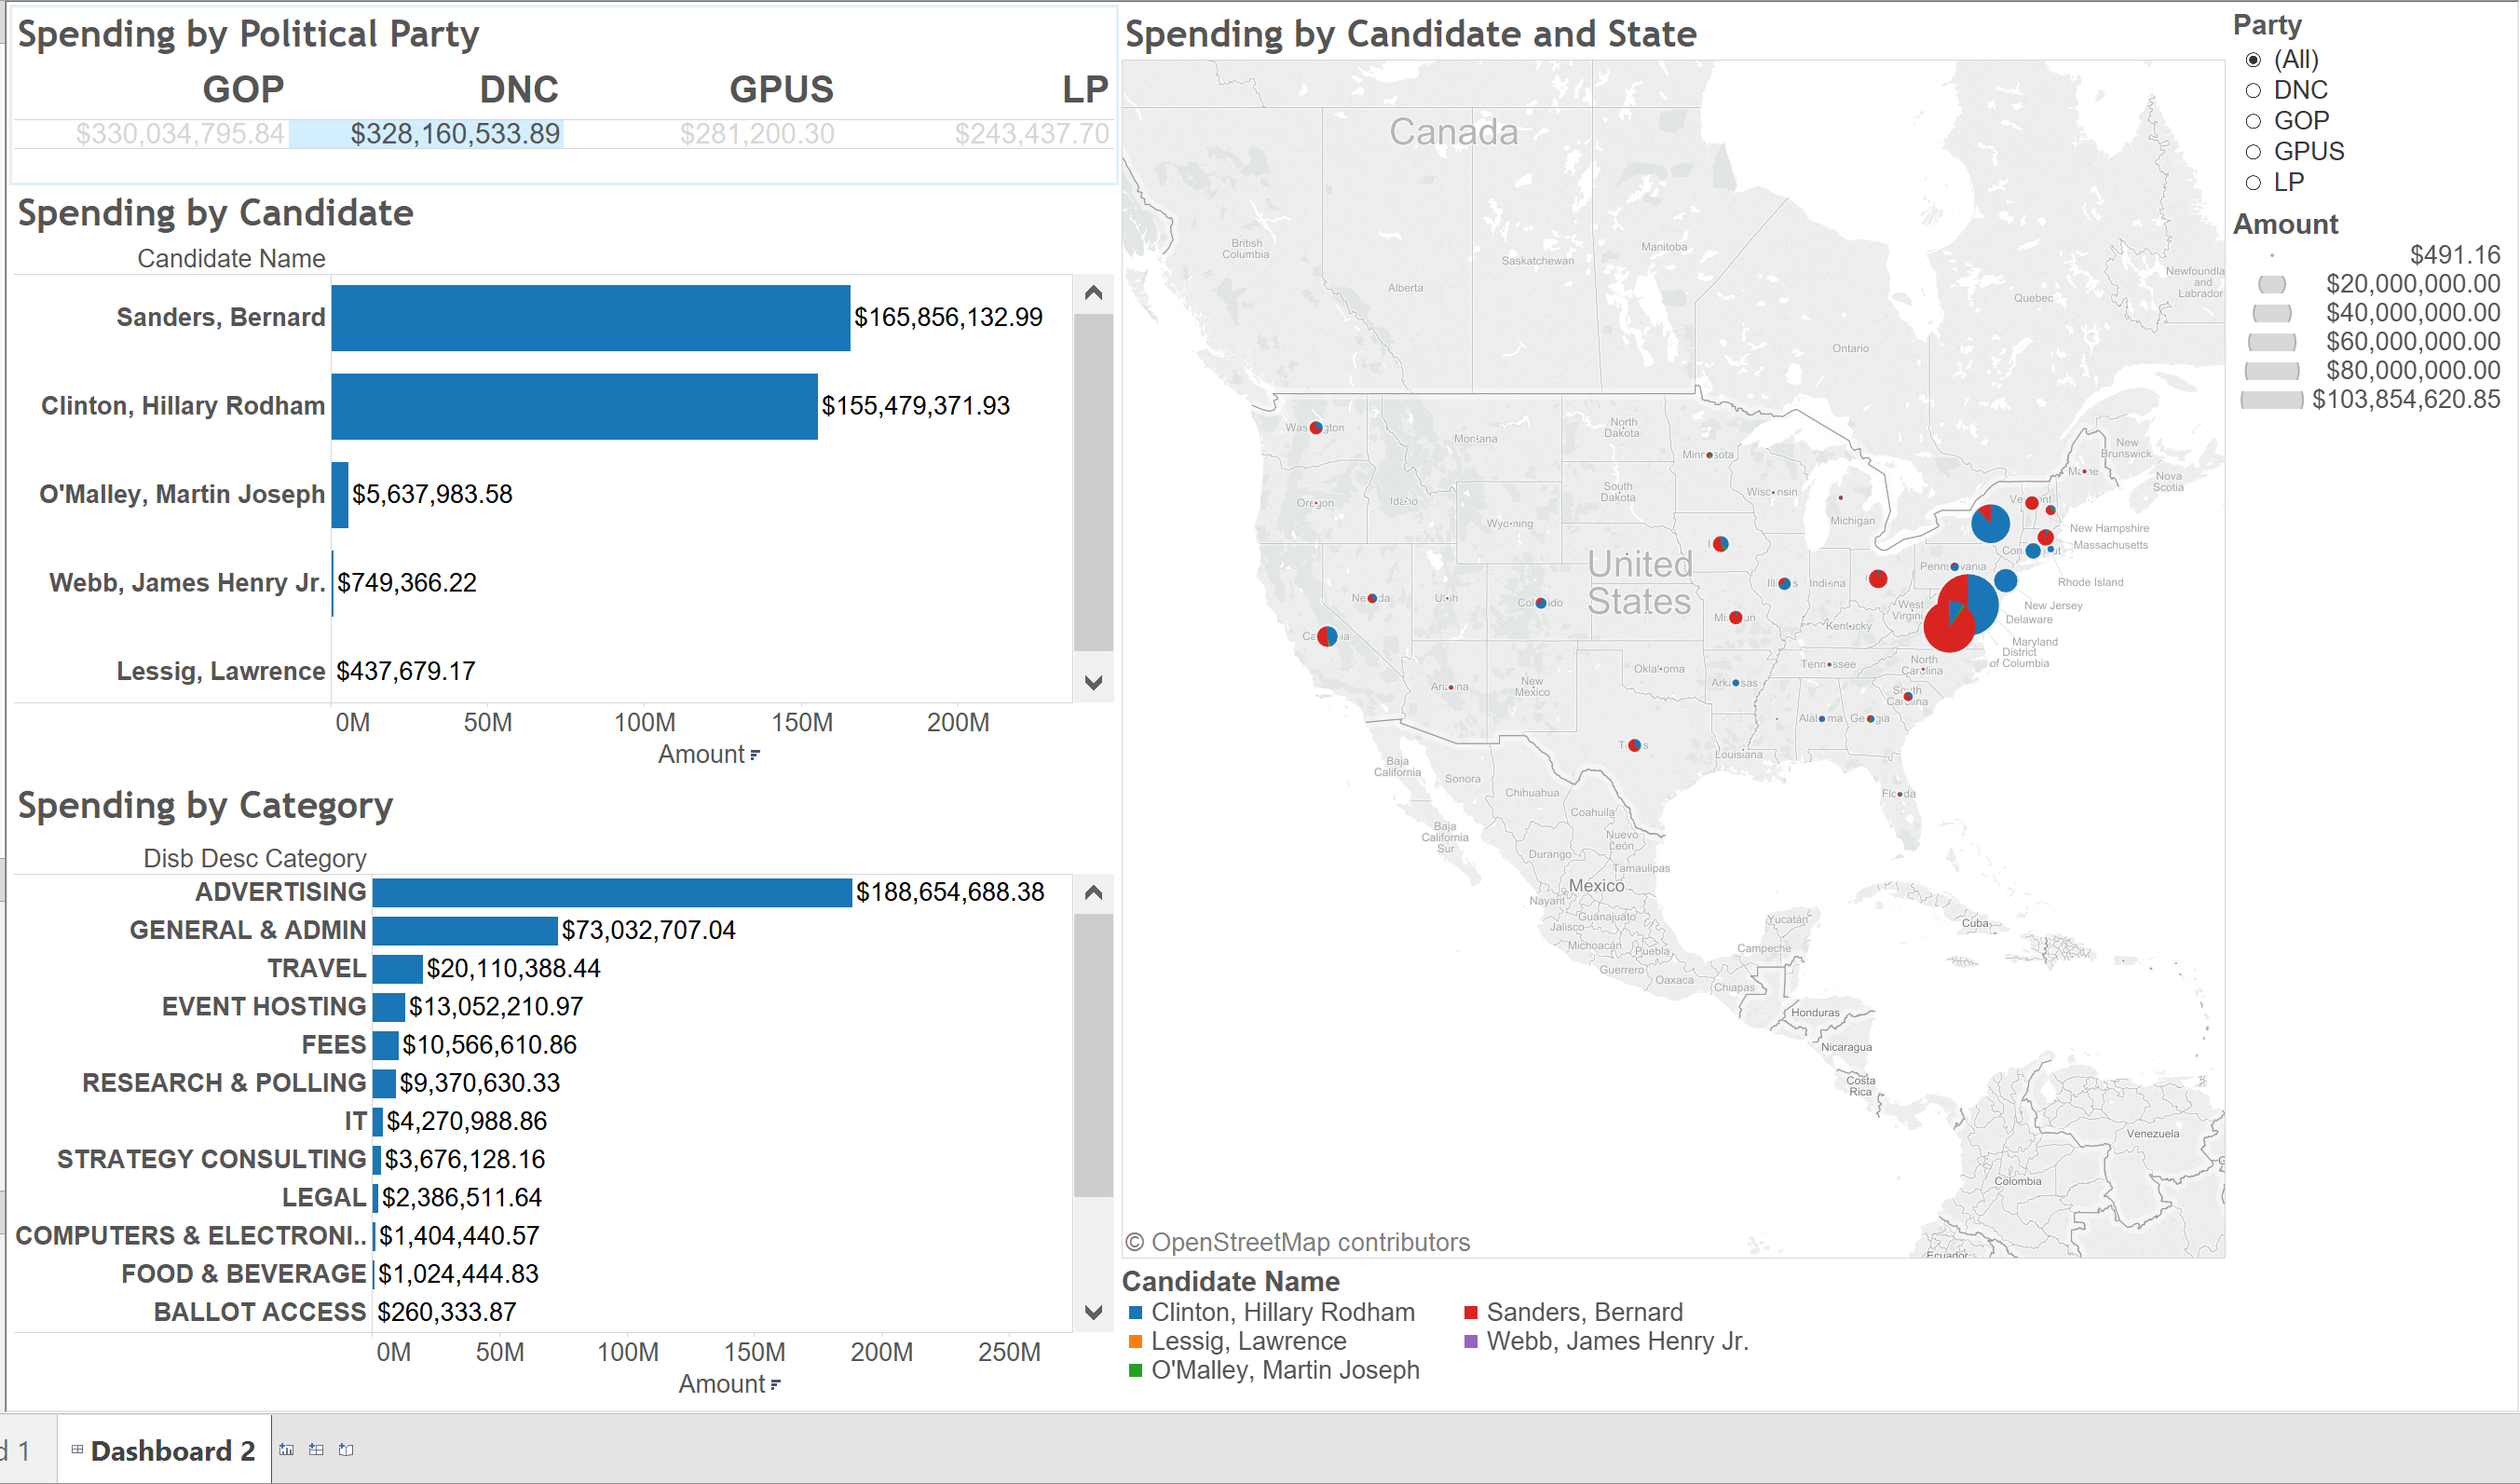
Screenshot 2: Sample Dashboard Created in Tableau Desktop using public presidential candidate spending data