Agile practitioners have long recognized the value of sizing Agile stories using relative sizing. Story Points are the most common unit of measure for Agile Teams that practice relative sizing. The most common scale used for story points is the Fibonacci sequence (1, 2, 3, 5, 8, 13, and so on). The benefit of Fibonacci is that each number is roughly 60% greater than the previous one (with the obvious exception of 1 and 2, of course). This streamlines the conversation by preventing debates about whether a story is a 6 or a 7, for instance. The difference between a 6 and a 7 would be small enough as to not be worth the time needed to come to consensus on it. So long as the team can come to consensus about whether a story is a 5 or an 8 (which is a more significant difference), the estimation process will result in the desired outcome.
Even with this streamlining mechanism, though, the process of sizing a story (determining what size to assign to it) can often get bogged down because of the factors we consider when sizing: effort and risk.
For instance, if Story A is high risk but low effort and Story B is low risk but high effort, how do you size them? If Story A is a 5, is Story B a 3 because it’s lower risk and that’s more important to the team? Is it an 8 because of the effort and the fact that Story A’s risk might not materialize and the effort will be low? Is Story B a 5 because the difference in risk cancels out the difference in effort?
This is exactly the kind of conundrum a team, especially a new team, could easily get stuck in. That’s usually a recipe for a long, frustrating conversation as the team feels its way through the issue and tries to decide where on this spectrum to put the story:
![]()
Streamlining Your Sizing Process Using a Relative Sizing Grid
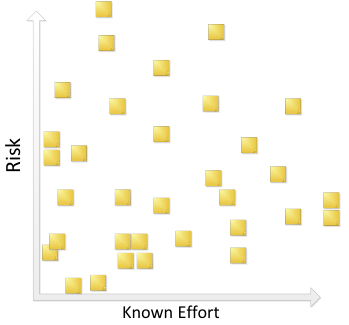
In order to further streamline the sizing process for a new team unfamiliar with story points, one option is using a Relative Sizing Grid without any numbers of other units of measure: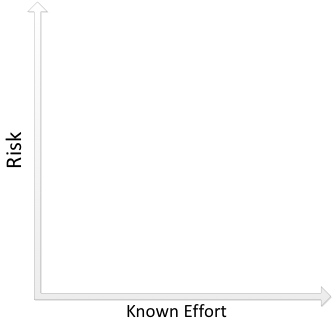
On to which the team plots their stories:
Once the stories are plotted, it’s time for the big reveal:
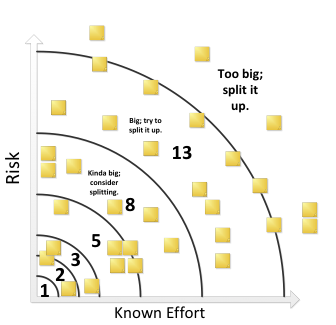
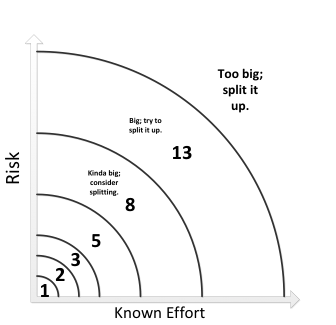
While this doesn’t add anything fundamentally new to the idea of relative sizing, it greases the skids by helping teams visualize and quickly gain consensus around the relationship between effort and risk. While you can do it on a whiteboard and manually draw the radii in, it is nice to use a projector with two slides – the first with just the axes and the second with the radii, numbers, and notes. Not only does it make for a good show, it deprives the team of the pleasure of mocking your inability to draw a consistent curve. 😉
After a while, the team will naturally develop the ability to size items without explicitly mapping them on this grid but it can accelerate the learning process and provide a solid foundation on which to build that capability.
So, there you have it. The Relative Sizing Grid:
Have questions about applying the Relative Sizing Grid? Need some help getting started? Contact Us.