Client
Truck Safety Coalition
Market
Non-profit
Industry
Trucking
Offerings
AI and Analytics
The Truck Safety Coalition (TSC) is a non-profit organization that works to reduce preventable truck crash deaths and injuries by advocating for safer drivers and vehicles.
To effectively communicate the volume and related fatalities of truck-related crashes to the public, policy-makers, and the media, TSC relies on volumes of disparate public data collected and stored by the Department of Transportation. Buried in disconnected tables and PDFs lies critical information about fatalities, injuries, accident locations, and more, from every state and county across the US.
Truck Safety Coalition: On a Mission to Save Lives with Data
From 2009 to 2017, truck-related fatalities went up 41%, while 44 states reported more truck crash deaths in 2017 than in 2009.
“Sadly the trends in truck safety are all going in the wrong direction,” said John Lannen, Executive Director of the Truck Safety Coalition (TSC). The non-profit organization tracks truck crash data to help educate the public and lawmakers on the very real, but often underreported, dangers of large truck accidents. “When a plane crash, or even a train crash happens, it’s headline news—it’s tragic. The equivalent for a truck is like a plane crash happening every week, but nobody knows about it,” said Lannen. For TSC, data is key to revealing just how serious the problem is. Lannen shared that if reporters, lawmakers, and the public could more easily view the data, they would not only be surprised by the numbers, they would be better informed about the realities of truck safety.
Making Raw Data Usable
The Department of Transportation collects large amounts of data from across the country, containing important details about injuries and fatalities from crashes in every state and county. However, the data isn’t shared in accessible formats for analysis and visualization and stems from several disparate data sets. In 2015, the government released open data sets on crashes through the National Highway Traffic Safety Administration’s Fatality Analysis Reporting System (FARS), with a call to the public and industry “to jump in and help us understand what this data is telling us.”
Since that initial call, TSC hoped to provide a response to the government’s call but did not have the technology or the data visualization, data analysis and data integration capabilities to perform the analysis. TSC also knew there was a clear need for an interactive exploratory visualization tool. They wanted to enable stakeholders to interact directly with collated data. Creating infographics and stat sheets were not only time-consuming but also didn’t allow them to easily reach their stakeholders, such as reporters and lawmakers across the country.
Excella partnered with the Truck Safety Coalition to join disparate datasets and transform previously inaccessible data into meaningful, highly visual, and readily available information. User-friendly features like charts and spatial maps reveal insights faster, and filter functionality enabling users to drill down to locations and populations of interest.

Visualizing Truck Safety with Tableau
To meet TSC’s needs of a highly visual tool accessible by anyone, at any time, Excella saw a path forward with Tableau. Harnessing Tableau’s data analysis and interactive visualization capabilities, Excella could both build a flexible, powerful tool that pulled information from various databases into one user-friendly, self-service platform.
Working with Excella’s experts, TSC identified several goals for the proposed tool:

Enable seamless analysis of FARS crash, fatality, and vehicle data.
Centralizing all 50 states’ data would make it much easier for users to track down the critical data, compare state data, or detect trends.

Facilitate deep exploration.
By blending data from multiple sources and providing various filter options, users can view aggregate statistics and drill down to specific types of accidents.

Increase awareness of truck safety issues.
The new dashboard is accessible any time, anywhere making it easier to share on social media or in a policy meeting.
Excella worked with the TSC team to focus on key stakeholder groups and identify the critical questions they would want to explore in the dataset. Then, working with the data blended from various FARS sources, the team built a quick prototype dashboard centered on a map view of all accidents – a key ask from the TSC team relevant across stakeholder groups.
Through a series of design reviews, the Excella team iterated on the initial prototype to develop the final dashboard. The team also identified additional interactivity features and secondary data sources that could be used to normalize data for cross-state comparisons, improving the usability of the tool. The TSC team brought in-depth knowledge of the data and could quickly eyeball anomalies and help to refine how age groups and fatality types were grouped.
The Power of Data Visualization
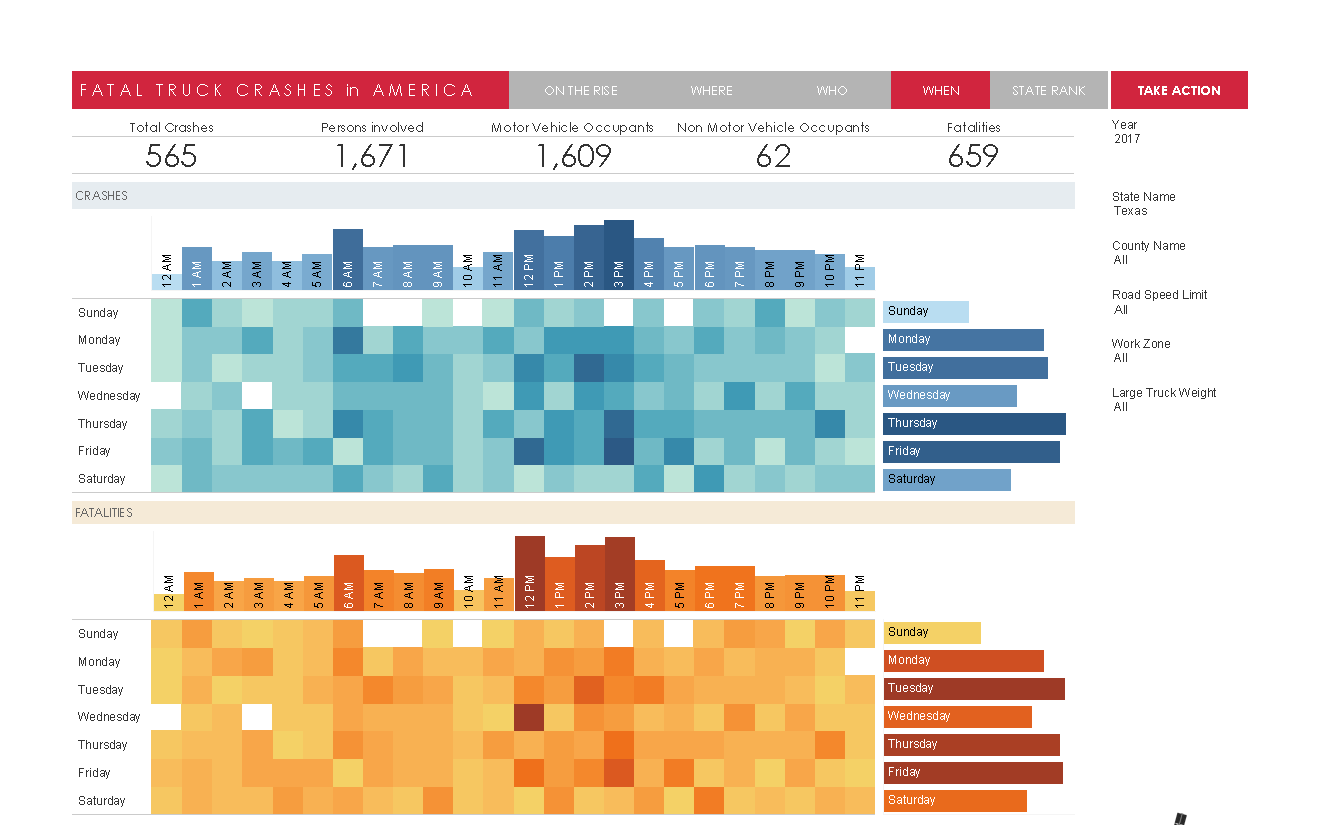
Combining the expertise and passion of Excella and TSC, the two teams created a centralized dashboard that portrays the data in a comprehensive way. The new tool enables:
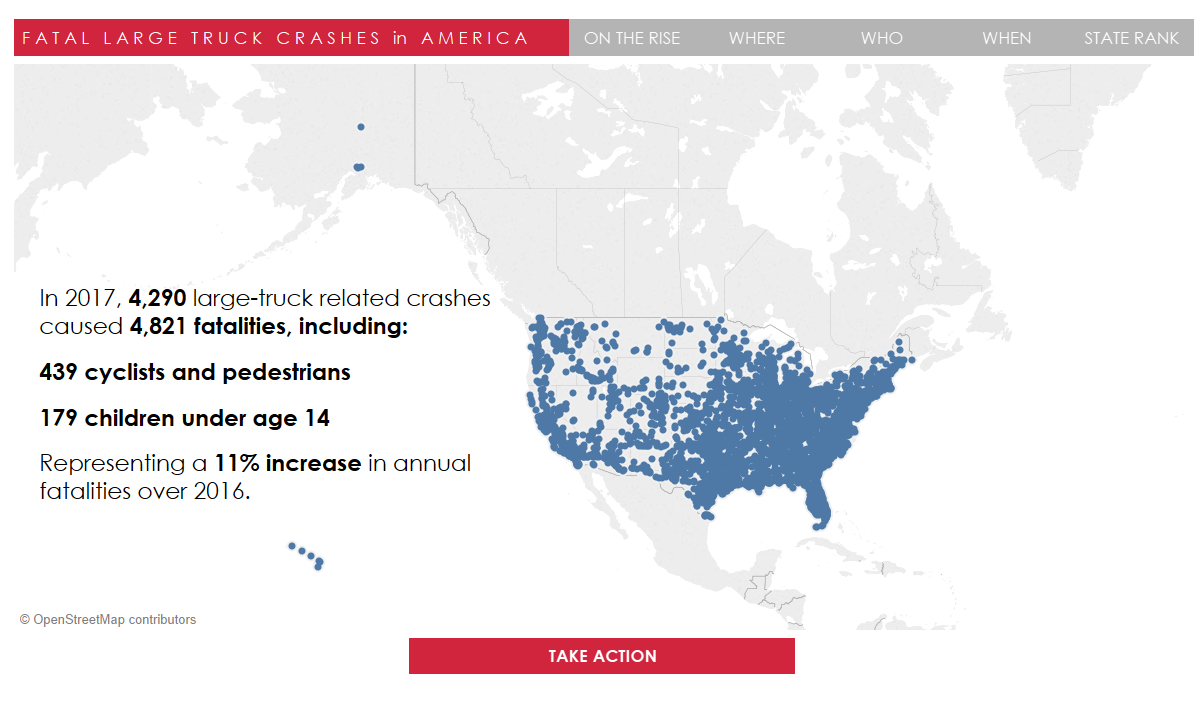
Visualization of national crash trends and patterns
Access to useful information for advocacy planning
Use of data to advocate for safety regulations to curb truck crashes in the future
In just two months, the Excella team produced a tool that was over three years in the making that included millions of pieces of data from multiple sources. The visualization tool is easily maintained by the Truck Safety Team and gives them the ability to change minds and possibly save lives.