The Department of Health and Human Services has a mission to reduce fraud, misuse of funds, and waste. To help in this effort, Excella is developing an application to help internal federal employees detect misuse of funds distributed by the agency. This complex tool pulls data from multiple sources to surface insights about discretionary funding fraud, waste, and abuse.
Development of a complex system requires diligent and frequent user input and feedback. Each iteration of the product is thoroughly tested with target audience members—there is never a release without user input. Since user experience and engagement are high priority, we have developed several methods to ensure that our product is reflective of user feedback by tracking user engagement.
Honing in on One User Attribute
After identifying which insights would be the highest priority for the stakeholders, we narrowed in on the actions that were the biggest indicators of success for those priorities. For example, we realized that we wanted to track each path that a user takes within the application to address the following items:
- See how easily users were finding what they were looking for
- Identify which pages were utilized the most and which were utilized the least
- Understand more about the most popular features and the most underutilized features
- Analyze if the pathways differed by department component and by department
Identifying Helpful Metrics to Help Define Each User Path
To answer these questions around the specific user attribute of path taken, we examined our usage data and identified helpful metrics like:
- Entry point into the tool to understand the most common arrival points
- Time of each action (page view, download etc.) to understand how long users spent within the tool
- Name of each page that users viewed on their journey to assess which pages are the most popular
- User’s department
- User’s supervisor
Creating Journey Maps and Visualizations to Accompany the Metrics
Equally important to tracking and extracting insight from the metrics is the ability to display these findings. Using a Sankey diagram to display these metrics made it easier to see the exact pathways that users were taking. Additionally, it allowed our team and stakeholders to see the metrics all in one place in an easy-to-digest format. We used the Looker software system because it allows users to click into a specific user pathway instance and view details such as the name of the user that took that pathway and when. It also lets you isolate the most frequently traveled paths and least frequently traveled paths per each group.
In this example, we see two pages, A and B, that can connect to three other pages, X, Y, and Z. Some of the connections are thicker than others, such as page B to page Y. This means that more people take the path from B to Y than B to X
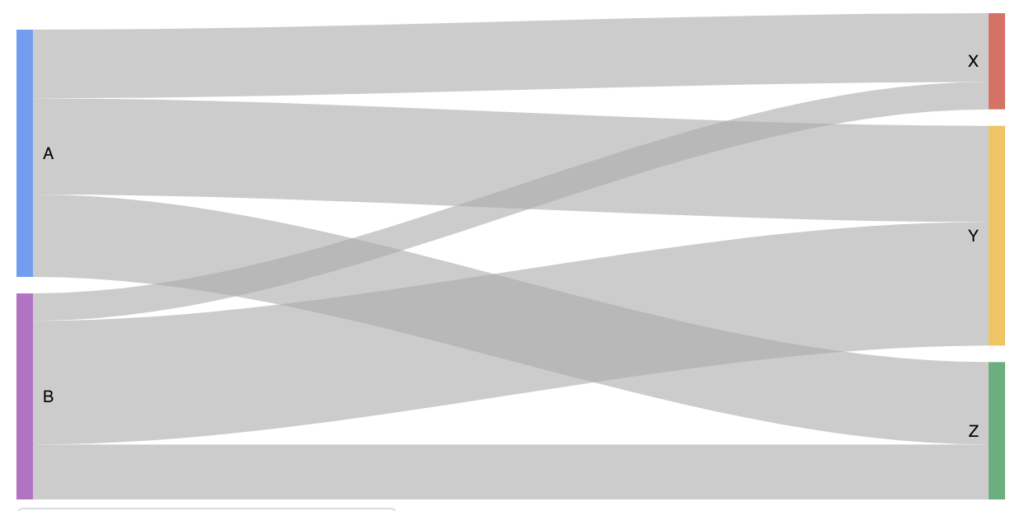
The above Sankey Diagram is from Google Charts: https://developers.google.com/chart/interactive/docs/gallery/sankey.
Ultimately, the clients would learn more about the problems and paths to focus on when discussing the tool in their meetings with the different departments. They would know which departments would need more attention because of their lack of familiarity with the tool. And alternatively, they would now know which departments would be receptive to more advanced trainings about the tool, given their higher experience level.
To fulfill the stakeholders’ request, our team developed a usage report measuring top user pathways per department. We identified the following metrics as being of most use for this report:
- User activity rank which analyzes (page views + searches) x total
- Supervisor information (which can be expanded upon and revisited based on our findings) in order to inform decisions about tool communications to teams
- Ranking of engagement level of the user groups at the organization with the tool
More Effective Change Management Strategies
With this new report, stakeholders are now able to trace user patterns in specific geographic locations to learn how they differ. Equipped with that knowledge, stakeholders can tailor their approach—leading to more effective meetings when traveling and presenting to the different regions. Using insights from the metrics, implementing the Change Management strategy becomes easier and more effective.
How You Can Apply a Similar Strategy with Your Client
Through this project, we have found engagement metrics to be highly effective in determining behavior and for developing more effective Change Management strategies. Our approach for developing user metrics to drive engagement decision-making is applicable for other business goals as well. Are there any opportunities that exist on your project to incorporate related findings? Here are some quick tips when getting started:
- Work cross-functionally to ensure your team is utilizing all available resources at its disposal to learn about its users
- Seek feedback from stakeholders about which metrics are most relevant
- Explore capabilities of current tools to see if there are any data visualization techniques that you may have overlooked that can be incorporated into a dashboard for team and client visualization
- Tailor reports to highlight metric changes that are most relevant to audiences