We’re a relatively small team of engineers at Excella focused on developing, improving, and maintaining the pipeline for a vital online system for one of the organizations we work with. We decided early on to use Kanban to manage our work. Initially, it was difficult to get a handle on all the competing demands, shifting priorities, and complex deliverables, but recently, we’ve been able to bring not just order, but some real improvements to our process by studying our Kanban and improving it. The most significant change we’ve achieved is a reduction in cycle time; it went from more than 10 days to less than 5. This has led to a number of benefits.
More Predictable Output
One of the most important benefits is that our output has become more predictable. With long and erratic cycle times, it was hard to anticipate how long it would take to complete a task. It could be days until someone was free to pick up a new, high priority item and then it could take weeks to finish. With shorter, more predictable cycle times, we can get started more quickly and expect that the work will only take a few days. That means when a client asks how long will it take to get something done, we can now say with confidence, “You should have it by the end of the week.”

A control chart of our cycle times for a two week period before some of our significant changes. The upper horizontal line is the upper control limit (3 standard deviations from the average); the blue line is the average, and the orange line is the plot of cycle times. The average is over 11 days and the process has a lot of variation.
How did we achieve this change? We used what our Kanban system was telling us, made a series of incremental improvements, and learned from them. When we started, we had just a simple Jira Kanban board. If you’ve used Jira for Kanban before, you know it has some limitations, but we’ve been able to overcome most of them. The first major change we made was to introduce a “Dev Review” column to identify items that required feedback or approval from the developers on the team. This helped ensure that the changes we made aligned with the broader architectural vision. It improved the situation, but items tended to languish once they got in there. More on that in a bit.
Better Kanban Board Layout
The second major change we made was to introduce WIP (Work in Process) limits for the columns on our board. WIP limits are an essential part of any Kanban system, and without them, we tended to take on too much work. That made it difficult to focus and get things done. We set our initial WIP limits together, as a team, using the board’s current state and how we’d been working as a rough guide. After we’d gained more experience, we refined them—raising them in some places and lowering them in others—to help ensure a better flow. Limiting WIP was one of the keys to lowering our cycle time. It also led to more teaming and closer collaboration within the team.
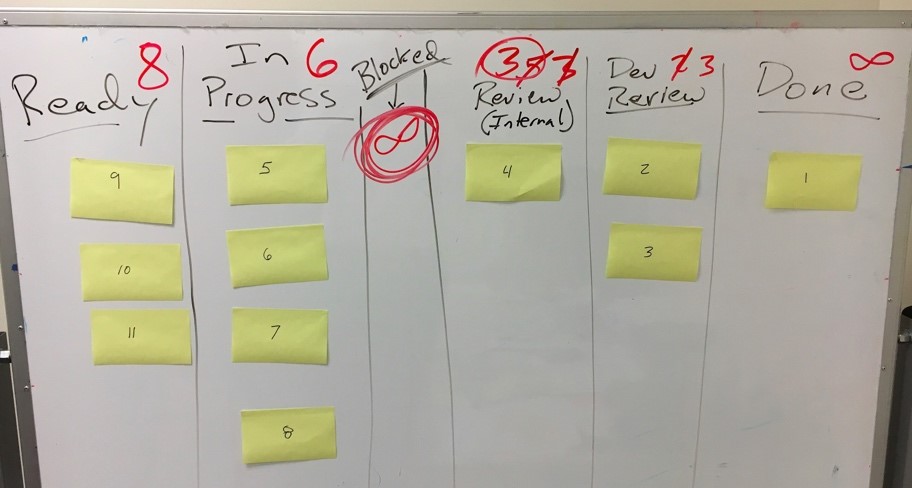
Some of our board brainstormings, when we were introducing WIP limits, and our realization that WIP could leak through the “Blocked” column.
About the same time, we introduced a “Blocked” column to identify the items that were in progress but blocked because of an external dependency. This raised the visibility of those items, helping bring the necessary focus from those outside the team to get them resolved. It also allowed us to quickly shift to other work that we could make progress on, improving our overall flow.
These changes helped lower the cycle time and make us more responsive to change. It used to be that when priorities shifted, we had to choose between abandoning a task half done or having to explain why we couldn’t adjust quickly. Now, because we’re finishing work more often, there are more opportunities to evaluate what we should be working on. This helps keep us aligned with priorities and focused on the most important tasks.
Improved Teamwork
Morale on the team has improved as a result. We like getting things accomplished and delivering value for our clients. We’re doing that more often while simultaneously being more responsive and working with more predictability. It’s improved our relationships with clients and with each other.
Further improvements were triggered by a process change at our daily stand-up. The team went from going around a circle and answering the three questions in turn, to walking through the work on the board. We started at the right-hand side and talked about those columns closest to “Done” first. This helped us highlight items in the “Dev Review” or Internal Review columns. Instead of them languishing, people spoke up at the stand-up and agreed to get them done. This was an excellent example of how using a visual board can help improve collaboration.
Tracking our cycle time and using the board has also triggered a change in how we plan our work. We had been comfortable creating a “story” for a large item with multiple independent tasks and having that story sit on the board for a long time, potentially even weeks. This didn’t give much visibility, prevented teaming, and led to long cycle times (with the consequent delays in feedback). We decided to change and break this work down. We now use “epics” in Jira to track these large items and use “stories” underneath them to track the independent tasks. Our emphasis is on “right-sizing” the work we bring into our system, breaking it down into a consumable chunk. This has helped lower the cycle time, give us more opportunities for feedback, and allow the team to work together more effectively. It sounds like a small change, but it’s had a big impact.
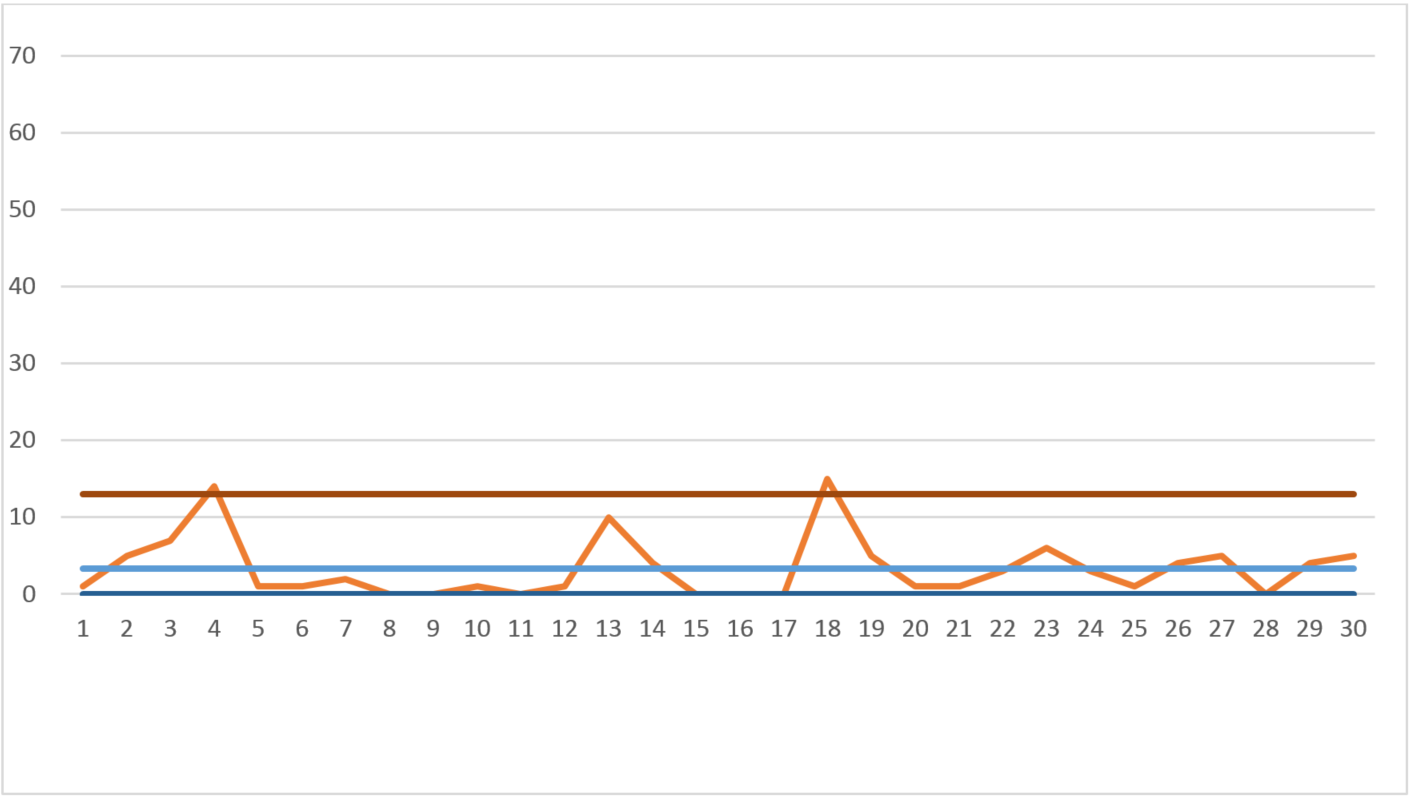
A control chart of our cycle times for a two week period after our changes. The upper horizontal line is the upper control limit (3 standard deviations from the average); the blue line is the average, and the orange line is the plot of cycle times. The average is just over 3 days and variation has reduced significantly (although note that we still have some items that exceed the upper control limit).
The more frequent opportunities to collaborate have helped improve our relationships within the team. We used to get heads down on a task for a long time before seeking feedback from peers. Now, with shorter cycles, we have more frequent reviews. That means more opportunities to share ideas and ensure we’re all working towards a shared goal. Because we’re deliberately breaking large tasks down, we work in parallel more often and collaborate on our client’s most important problems.
Looking Ahead
The reduction in cycle time has been pretty dramatic. When we started, we weren’t actively tracking it. Jira kept some numbers for us, but we didn’t really use them. Once we introduced WIP limits, we started keeping an eye on cycle time. Our average at that point was a bit over 10 days per work item. Since then, with changes we’ve made to our board layout, “right-sizing” and the standup, we’ve cut it down to under 5 days. This has helped trigger all the benefits we’ve experienced. Short cycles keep our motivation high, improve collaboration, and have definitely made us more predictable.
To continue driving improvements, we’ve planned a few events for the upcoming weeks. We’re going to run a retrospective on some of our outliers—the tickets that took abnormally long to complete. We have a few that took more than 20 days and we think there might be some valuable lessons in talking about them, determining what happened, and seeing what we could do differently.
We can identify them pretty easily because of the control charts we’re using to monitor our cycle time. Although we’re not working on a sprint cadence, some of the teams we work with are, and we run a control chart for every two week period. When a new one comes out we compare it to our past performance and see what we can learn from it. It’s a good way to observe and learn from the longer-term behavior of our system.
That’s the great thing about Kanban; it’s a clear reflection of the state of our work. By making that work visible, our board and our metrics give us rapid feedback on what we’re doing and how we’re doing it. We can leverage that feedback to continually improve. We’ve made a lot of progress so far and are excited to see what comes next.